In my last blog entry, I described how to code asynchronous remote communications between a JavaFX application and a REST service.
I used, as sample JavaFX application, a pie chart component.
In this blog entry, I will explain how to build a PieChart, i.e. a reusable JavaFX class to be embedded in your own applications.
This blog entry will be in two parts :
-
Part 1 will describe the basic of creating a Pie Chart component (this blog entry)
-
Part 2 will describe how to make the component nice looking by adding behavior and 3D effects (to be published soon)
Before writing any piece of JavaFX code, you will need to download and install the JavaFX SDK, either standalone, either bundled with NetBeans IDE.
As a component user, I would like a reusable component with an easy to use API that let me specify the following :
-
the values to be part pf the pie chart
-
the center and size of the component
-
the colors to be used
These will be the public attributes that end users will be able to specify. Because I want the component to be easy to use, all these attributes (except the pie chart values) will have defaults, freeing component users to specify a value for each of these.
The first draft of the code will therefore look like this :
public class PieChartFX extends CustomNode {
public-init var colors = [ Color.rgb(83,130,161), Color.rgb(0,84,128), Color.rgb(248,152,29), Color.rgb(194,205,0), Color.rgb(255,199,38), Color.rgb(253,185,19)];
   public-init var radius: Integer = 100;
   public-init var center = 125;
   public var values = [ 0.0 ];
}
The values are expressed as an array of values.
center and radius are self explaining
The colors are expressed as an array of Color that will be used in a sequential order in the Pie.
The default values for the colors are the one from the Sun Color Palette, feel free to replace with whatever makes sense for you.
What makes a Pie ?
Technically, drawing a Pie is very easy. A Pie is a set of Arc components, all having the same center and where the sum of Arc’s angles is a full circle, i.e. 360 degrees.
There are two main steps in your Pie drawing code
-
Step 1 : convert the array of (arbitrary) values to an array of values where the sum is 360, each value being proportional to the original array value. For example, when the component user is giving us [25, 50, 25] it will be converted to [90, 180, 90]
This array will contain the angle values for each part of the Pie -
Step 2: draw an Arc component of the given angle (see Step 1), starting at the angle where the previous Arc finished. Our code will need to count the sum of angles we’ve drawn so far.
Actually, to make the drawing code easier, I chose to build two arrays : one to contain the angle values, the other to contain the start angle values.
Code goes like this :
//count the total values of the sequence var totalValue: Number = 0;
for (v in values) totalValue += v;
var sum = 0.0;
//create array of ANGLE_VALUES, sum is 360,
//pondered by percentage of each value
for (v in values) {
var percentage: Number = (v / totalValue);
   var newAngle = 360 * percentage;
insert newAngle into ANGLE_VALUES;
insert sum into START_VALUES;
sum += newAngle;
}
Having these two arrays will make the drawing code itself extra simple : just walk through each of these arrays and create an Arc with the corresponding start angle, angle value and color.
def ARCS : Arc[] = for (angle in ANGLE_VALUES ) {
var start = START_VALUES[ indexof angle];
   Arc {
centerX:  center
centerY:  center
radiusX:  radius
      radiusY:  radius
      startAngle: start
      length: angle
      type: ArcType. ROUND
      fill: colors[(indexof angle) mod colors.size()]
   }
}
The code above will create an array of Arc instances, in the order of the values computed in the ANGLE_VALUES array. The colors will be using in the corresponding order of the colors array, going back (mod) to the first one when all colors have been used.
Creating the component
Classes that extends CustomNode must overwrite the create() method to actually return something displayable in a Scene.
public override function create(): Node { return Group { content: bind ARCS; } }
In this code, we create a Group object made of our previously build array of Arc.
Redrawing when values changes
Wouldn’t it be cool to have our Pie Chart to redraw itself automatically when the user change the array of values, either replacing values, removing some or inserting new ones ?
JavaFX makes it very simple to code this type of behavior with two keywords : bind and on replace. Bind allows to link, at runtime, the value of a variable or attribute with the value of an expression. Each time the expression is changed, the value is recalculated and updated.
On replace behaves like a trigger in a RDBMS, it allows to execute code when the value of a variable or attribute is changing.
First, we want to recompute our angles when the values provided are changing.
public var values = [ 0.0 ] on replace oldValue[firstIdx .. lastIdx] = newValues { ... }
The code between { and } is the code listed above to compute ANGLE_VALUES and START_VALUES
Secondly, I want my ARC array to be changed each time new values are provided. This is where the bind keyword is used, just replace the ARC definition listed above with
def ARCS : Arc[] = bind for (angle in ANGLE_VALUES ) { ... }
Using the component
In your Main class, use the code below to actually create and display a PieChart
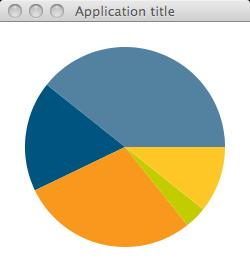
Stage {
title:  "Application title"
width: 250
height: 270
scene: Scene {
content: PieChartFX {
values: [ 110, 50, 80, 10, 30]
}
}
}
The end result is displayed below.
My next blog entry will improve this component : we will add some 3D look and we will add code to slightly move a piece out of the PieChart when the mouse is over it. Full source code will be provided.
Stay Tuned !
#1 by Ganesh Prasad on 01/04/2010 - 20:19
Hi Sebastien,
This is a fascinating example. I want to get the pie chart working with a REST service, and I’ve used your code to do it, but I’m unable to get it working. Do you have the full working code somewhere that I can download and play with?
Thanks and regards,
Ganesh
#2 by Anonymous on 01/04/2010 - 22:40
Hello Ganesh,
We did develop a LAB for JavaONE 2009 describing precisely this – how to combine this Java FX Pie component with a REST based data source.
You will find the LAB on Sun Developer Network at http://developers.sun.com/learning/javaoneonline/j1lab.jsp?lab=LAB-5557&yr=2009&track=1
Enjoy !
Seb