Posts Tagged javafx
JavaFX Client for JAX-RS Tutorial
Posted by Sébastien Stormacq in Java on 23/11/2010
| Last week, during the Devoxx conference, Alexis (Java and GlassFish dude) and Antonio (book author and Paris JUG Leader) gave a Java EE 6 hands-on training session.
They based their labs and samples on the Java EE 6 Tutorial code sample project available on Kenia.com I modestly contributed to Demo 11, JAX-RS and Jersey. The demo already included several clients (web based, android,…) and we added a JavaFX application to the set. You can get the source code from Kenai and experiment with it (this a NetBeans project that should compile just fine with NetBeans 6.9) Have fun ! |
 |
Custom components in JavaFX 1.3 – revisited
Posted by Sébastien Stormacq in Java on 18/11/2010
Last year, I posted some details about creating your own UI control using JavaFX, by subclassing the Node class and extending it the way you like. For the sake of this example, I created a custom Search Control based on JavaFX’s TextBox
Last month, Oracle did release a new version of JavaFX, version 1.3.1. This version includes a whole bunch of welcome changes but, unfortunately, some incompatible APIs changes.
Net result : my search text box sample is not compiling anymore.
When subclassing Node class, it is not longer permitted to override the children property. This property contains an Array of Node instances. You just rip and replace the component’s original array or you add your nodes into the array.
JavaFX 1.3 also introduces some subtile changes in the CSS properties names. Specific JavaFX properties names are now starting with “-fx-”
My modified sample application is available to download or you can just Java Web Start it by clicking on the “Launch” button below.

As usual, comments and remarks are welcome. Have fun !
JavaFX Talk at Brussel’s Java User Group
Posted by Sébastien Stormacq in Java on 06/09/2010
This week I will present JavaFX to the BruJUG folks.
The talk will be divided in two parts :
- During part #1, I will present the JavaFX programming language and associated tools. This will be a one-o-one discovery tour for people without previous experience with JavaFX.
- Part #2 will be a hands on lab based on my JavaONE 2009 talk. This lab will provide step by step instructions to build a JavaFX RIA with asynchronous REST communication to a web service deployed in GlassFish.
Should you plan to attend part 2, be sure to download and install NetBeans 6.9.1. From the download page, pickup the largest bundle, the one including JavaFX and GlassFish.
BruJUG events are free and open to everyone. Should you happen to be in Europe’s Capital this Wednesday, feel free to join (but do not forget to register first for obvious logistic reasons)
How to Create an Animated JavaFX’s Line Chart ?
Posted by Sébastien Stormacq in Java on 19/07/2010
Java FX introduced charting components back in 1.2 version : AreaChart, BubbleChart, PieChart, LineChart … you name it.
You will find a good introduction to LineChart capabilities in Rakesh’s blog entry.
One common request found in forums and blogs over the Internet is to create an animated LineChart, i.e. a line based chart where the line is moving from left to right as values are added to the component.
JavaFX.com official website even host an ugly attempt to implement this : by moving a Rectangle over the scene, gradually showing the chart below it. (nope, this is not a joke, go and read it by yourself)
While preparing sessions and labs for the upcoming JavaONE 2010 conference, my colleague David and myself did implement a true Animated LineChart component.
This component exposes a very simple public API :
public function addValue(v:Integer) {}
Each time a value is added to the graph, the line will move to the right side, possibly discarding older values on the left side when the line will reach the graph’s right border.
The magic is done as following : new values are added to the LineChart.Series[0].data[] array. When the array is filled in (when the number of elements in the array is equal to the number of tick marks available on the X axis), the oldest value (LineChart.Series[0].data[0]) is removed and all values are shifted one position left in the array.
Source code and detailed instructions to build this AnimatedLineChart component will be given during our JavaONE 2010 Hands-On Lab (S616734 currently scheduled for Thursday, 23rd at 12:30 pm at the Hilton) (see UPDATE at the end of this post)
In the meantime, you can have a look at the screenshot below.

[UPDATE : November 2011]
Due to popular demand, and because we learned that Oracle will not make JavaOne’s talk freely available to all, like Sun use in the past, here is the source code for this component. Enjoy !
JavaFX talk at the Transylvania JUG
Posted by Sébastien Stormacq in Java on 11/06/2010
| A couple of weeks ago, I had the pleasure to be invited to deliver a talk and a lab to the Java developper community in Cluj, Romania: the Transylvania Java User Group.
I was surprised to discover a highly motivated and vibrant set of folks. Like usual, we had excellents exchanges before and after the lab Lab and presentation materials are now available (a free registration is required for the Lab material) Pictures of these two evenings will be shortly posted too. |
JavaFX presentations and demo during our last JUG meeting
Posted by Sébastien Stormacq in Java on 27/07/2009
A couple of days ago, the Luxembourg Java User Group – YaJuG – and the Lorraine JUG held a last meeting before the holiday season. They invited Simon Ritter and myself to talk about ademo JavaFX.
The meeting was organized on a boat (une péniche) usually dedicated for theatre performances.
The slides are now posted on YaJuG’s web site while Lorraine JUG posted some pictures on Picassa.
French local newspaper "Le Républicain Lorrain" wrote a short paper about this and even sent a photograph for the occasion (lower left of the page, in french !).
Fun with JavaFX, how to subclass UI controls
Posted by Sébastien Stormacq in Java on 15/06/2009
While I was doing a JavaFX demo to a group of partners, someone asked the questions : “Does JavaFX provides more specialized UI controls, like SearchTextBox, Table etc … ?”
As of today, JavaFX 1.2 proposes this list of controls and, of course, it is relatively easy to subclass these to get the behavior you want.
But I wondered how easy it really might be, so I tried.
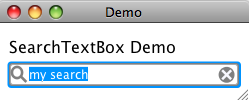
| My goal was to create a “Search Text Box”, you know ? These TextBoxes used in Apple’s iTunes for example to clearly indicate that this control is to search.
It has a small glass in the front of the text area and a “cancel” button appears when text is typed to allow user to reset it’s content in a click. It took me a couple of hours to create it, here is the result on the right side. |
|
I basically extended JavaFX 1.2 TextBox control and added two groups :
- One is the “Cancel” button, made of gray Circle and two Rectangles
- The other is the glass, made of one Circle and one Rectangle
I positioned these inside the TextBox, relatively to the original control’s size.
I added two callback functions to notify about possible events : new search text is available (onSearchItemAvailable) and search is reset (onResetSearch).
I finally struggled a little bit to find a way to prevent text to draw itself beneath these two icons. It was solved using the skin’s padding-left and padding-right CSS attributes (Thanks Philippe from Sun’s Developpers Forum to point me in the right direction).
You can download the full source code here or you can start the test application directly from this page by clicking on the image below.
As usual, comments and remarks are welcome.
[UPDATE – JAVAFX 1.3]
In October 2010, Oracle released Java FX 1.3 with incompatible changes in the API. Direct consequence is that this example is not compiling anymore. I posted the explanation and an up-to-date version, ready for Java FX 1.3. Have Fun !
JavaFX within WebSpace Portlets
Posted by Sébastien Stormacq in Java on 25/02/2009
I am attending a WebSpace bootcamp this week, which gives me some extra time to discover Sun’s new Identity Based Content Portal.
I couldn’t resist to try to deploy my JavaFX PieChart application in a JSR 268 portlet.
Here is the result

Here are a few caveats / things to know
-
Use NetBeans’ project properties on the JavaFX side to generate the required HTML and proper embedding of the JavaFX librairies. Choose “Run” category, then specify “Run in a browser”. This will generate the HTML for you
-
Create a Web Application / JSR 268 Portlet project and copy/paste the HTML from the previous step to the portlet view JSP
-
Deploy the WAR file using Web Space admin tool (the web based Control Panel – Plugin Installer)
-
Add the portlet to an organization / community / user page.
Be careful about the path to your JAR file, it must be downloadable from your client browser. WebSpace overwrites the main context-root “/” and redirects everything to its own pages. I was lazy and just pointed to a file:/// URL 🙁
Have Fun !
Create a reusable PieChart component with JavaFX – Part II
Posted by Sébastien Stormacq in Java on 22/02/2009
In my previous blog entry, I described how to build a reusable PieChart component with JavaFX.
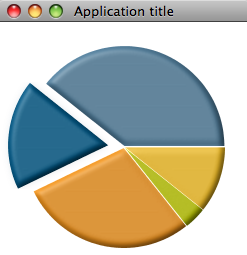
In this blog entry, we will improve the component to make it visually more appealing :
-
we will add a small space between pieces of the pie
-
we will add a 3D like effect to the component
-
we will add behavior : when the user will move the mouse over one of the piece, it will slightly step outside the chart.
End result will be like this :
| Before: | After: |
 |
 |
The 3D effect
Let’s start with the simplest modification, the 3D effect.
JavaFX does provide with many lightning effects that can be applied either to simple, individual component or to complete scene.
Many of these lightning effects create 3D like effects on the component they are applied.
To achieve the effect shown above, I just added a DistantLight effect to the component, as show below.
 public override function create(): Node {
     return Group {
        content: bind ARCS;
        effect: Lighting {
           light: DistantLight {
             azimuth: 225
              elevation: 60
           }
           surfaceScale: 3
        }
    }
 }
The three first line are taken from my previous code. It creates a subclass of Node, for which the content is an array of ARC. Please read the previous blog entry to have details about this.
I added to the group an effect attribute. This attribute contains a Lighting instance which, in turn, contains a DistantLight lighting effect.
This is as simple as this, it will create the lighting and shadow effects to create the illusion of a 3D component.
Back to your Math basics
The other changes will require some math first …
We want to move a piece of the chart outside the pie chart when the mouse is over it.
Moving an Arc is easy, JavaFX provides us with many transformations, including a simple TranslateTransformation that will move the Arc from a source coordinate (a,b) to a destination coordinate (x,y).
The source point is well known, it is the center of the PieChart component. How can we compute the destination point ?
The target point dependents on two factors : the direction where we will move the piece and the distance from the center where we want to stop.
For the direction, we will use the angle in the middle of the arc, i.e. (end angle – start angle) / 2
For the distance, we will use a percentage of the radius, 15% in this case (you might wonder how I found 15% … it was using trial and mistake approach, 15% seems to give the best result, feel free to use whatever other value you like)
So, how can we compute the x,y point as destination of the Translate movement ? This is where we need to go back to our first grade math course – or – wikipedia 🙂 .
Any point on the circumference on a circle can be expressed with the following equation :
-
x = a + r cost t -
y = b + r sin t
where (x,y) is the destination point, (a,b) is the source point, r is the radius of the circle and t the angle to (x,y) (aka the direction where we want to go)
Should I translate these equations to our PieChart component :
-
(a,b) is the center of the component
-
r is 15% of the component’s radius
-
t is (end angle – start angle) / 2
All the values are known: x,y is easy to compute !
Apply the formula in JavaFX
Now than we know how to compute the destination point of an Arc, adding the Translate transformation is relatively easy.
Let’s first define a couple of constants
 def ANIMATION_DURATION = 0.5s;
  def ANIMATION_DISTANCE = 0.15;
The distance is expressed as a percentage of the component’s radius, while the duration is expressed in seconds.
Then, in the Arc component definition, add the onMouseEntered and onMouseExited method to apply the transformation.
def ARCS: Arc[] = bind for (angle in ANGLE_VALUES) {
   (...)
    var cos = Math.cos(Math.toRadians(0 - start - angle / 2));
    var sin = Math.sin(Math.toRadians(0 - start - angle / 2));
Arc {
   (...)    Code to define the Arc, see full code source in previous blog entry    (...)
     onMouseEntered: function(e: MouseEvent):Void {      //pie is moved to the outside of the circle      //cfr Circle equations
var transTransition = TranslateTransition {
duration: ANIMATION_DURATION node: ARCS[indexof angle] fromX: 0 fromY: 0 toX: (radius * ANIMATION_DISTANCE) * cos; toY: (radius * ANIMATION_DISTANCE) * sin; } transTransition.play(); }
onMouseExited: function(e: MouseEvent):Void {
//piece if moved back to center
var transTransition = TranslateTransition { duration: ANIMATION_DURATION node: ARCS[ indexof angle] toX: 0 toY: 0 fromX: (radius * ANIMATION_DISTANCE) * cos; fromY: (radius * ANIMATION_DISTANCE) * sin; } transTransition.play(); } } }
First, we compute the cos and sin values as they will be used in multiple places. We are using the java.lang.Math package for this. Note that these methods are expecting angles expressed in radians, not in degrees, hence the required conversion.
As their names implies, the onMouseEntered and onMouseExited function are called whenever the mouse enters or exists the Node where the functions are defined.
The code in these function creates a TranslateTransition object with the following properties:
-
duration: the duration to play the animation
-
node: the graphical component it applies to, in our case, the Arc we are currently building
-
fromX, fromY: the start of the transition (aka the center of the Pie Chart when the Arc is moving out)
-
toX, toY: the end coordinate of the transition, this is where we do apply our math formula : ( radius * percentage) multiplied by cos or sin, for x and y respectively.
The last line actually starts playing the transformation.
The onMouseExited method only differs by the fact we switched the from and to coordinates.
Add a small line between the pieces
I noticed that PieCharts are prettier when individual slices are separated by a couple of pixels instead of being sticked together (if you are not convinced, check the “before” and “after” screenshots above).
I first implemented this by drawing smaller Arcs, i.e. using a start angle + 1 and an end angle – 1. This technique gives indeed a small white line between the pieces, but the line is getting smaller and smaller towards the center of the Pie, as the center stays the same for all pieces.
To get the result I wanted, I shifted the whole piece away from the center by a couple of pixels. Each piece needs to be shifted away in different directions. Instead of giving x,y the coordinate of the center, I am using center + … and this is where our math basics are needed again.
We just need to apply the same equation to compute the x,y coordinate, slightly away from the center. I chose 1% of the original radius as a distance from the center.
//center is adjusted in the direction
//of the pie to create a gap between pieces
centerX: center + (radius * 0.01) * cos
centerY: center + (radius * 0.01) * sin
The Final Touch
Now that we added a 3D like effect and a movement in and out when the mouse is over a piece of the chart … let’s add our final touch.
We will add a gentle Glow effect on a piece when the mouse is over it.
We will add a couple of lines of code in the onMouseEntered and onMouseExited created previously.
 //very discrete glow effect
  ARCS[ indexof angle]. effect = Glow {    level: 0.1;  }
level is set to 0.1 when the mouse enters the piece and set to 0 when the mouse leaves the piece.
Full source code is provided as a NetBeans project or you can start the test application directly from this page by clicking on the image below.
Create a reusable PieChart component with JavaFX – Part I
Posted by Sébastien Stormacq in Java on 15/02/2009
In my last blog entry, I described how to code asynchronous remote communications between a JavaFX application and a REST service.
I used, as sample JavaFX application, a pie chart component.
In this blog entry, I will explain how to build a PieChart, i.e. a reusable JavaFX class to be embedded in your own applications.
This blog entry will be in two parts :
-
Part 1 will describe the basic of creating a Pie Chart component (this blog entry)
-
Part 2 will describe how to make the component nice looking by adding behavior and 3D effects (to be published soon)
Before writing any piece of JavaFX code, you will need to download and install the JavaFX SDK, either standalone, either bundled with NetBeans IDE.
As a component user, I would like a reusable component with an easy to use API that let me specify the following :
-
the values to be part pf the pie chart
-
the center and size of the component
-
the colors to be used
These will be the public attributes that end users will be able to specify. Because I want the component to be easy to use, all these attributes (except the pie chart values) will have defaults, freeing component users to specify a value for each of these.
The first draft of the code will therefore look like this :
public class PieChartFX extends CustomNode {
public-init var colors = [ Color.rgb(83,130,161), Color.rgb(0,84,128), Color.rgb(248,152,29), Color.rgb(194,205,0), Color.rgb(255,199,38), Color.rgb(253,185,19)];
   public-init var radius: Integer = 100;
   public-init var center = 125;
   public var values = [ 0.0 ];
}
The values are expressed as an array of values.
center and radius are self explaining
The colors are expressed as an array of Color that will be used in a sequential order in the Pie.
The default values for the colors are the one from the Sun Color Palette, feel free to replace with whatever makes sense for you.
What makes a Pie ?
Technically, drawing a Pie is very easy. A Pie is a set of Arc components, all having the same center and where the sum of Arc’s angles is a full circle, i.e. 360 degrees.
There are two main steps in your Pie drawing code
-
Step 1 : convert the array of (arbitrary) values to an array of values where the sum is 360, each value being proportional to the original array value. For example, when the component user is giving us [25, 50, 25] it will be converted to [90, 180, 90]
This array will contain the angle values for each part of the Pie -
Step 2: draw an Arc component of the given angle (see Step 1), starting at the angle where the previous Arc finished. Our code will need to count the sum of angles we’ve drawn so far.
Actually, to make the drawing code easier, I chose to build two arrays : one to contain the angle values, the other to contain the start angle values.
Code goes like this :
//count the total values of the sequence var totalValue: Number = 0;
for (v in values) totalValue += v;
var sum = 0.0;
//create array of ANGLE_VALUES, sum is 360,
//pondered by percentage of each value
for (v in values) {
var percentage: Number = (v / totalValue);
   var newAngle = 360 * percentage;
insert newAngle into ANGLE_VALUES;
insert sum into START_VALUES;
sum += newAngle;
}
Having these two arrays will make the drawing code itself extra simple : just walk through each of these arrays and create an Arc with the corresponding start angle, angle value and color.
def ARCS : Arc[] = for (angle in ANGLE_VALUES ) {
var start = START_VALUES[ indexof angle];
   Arc {
centerX:  center
centerY:  center
radiusX:  radius
      radiusY:  radius
      startAngle: start
      length: angle
      type: ArcType. ROUND
      fill: colors[(indexof angle) mod colors.size()]
   }
}
The code above will create an array of Arc instances, in the order of the values computed in the ANGLE_VALUES array. The colors will be using in the corresponding order of the colors array, going back (mod) to the first one when all colors have been used.
Creating the component
Classes that extends CustomNode must overwrite the create() method to actually return something displayable in a Scene.
public override function create(): Node { return Group { content: bind ARCS; } }
In this code, we create a Group object made of our previously build array of Arc.
Redrawing when values changes
Wouldn’t it be cool to have our Pie Chart to redraw itself automatically when the user change the array of values, either replacing values, removing some or inserting new ones ?
JavaFX makes it very simple to code this type of behavior with two keywords : bind and on replace. Bind allows to link, at runtime, the value of a variable or attribute with the value of an expression. Each time the expression is changed, the value is recalculated and updated.
On replace behaves like a trigger in a RDBMS, it allows to execute code when the value of a variable or attribute is changing.
First, we want to recompute our angles when the values provided are changing.
public var values = [ 0.0 ] on replace oldValue[firstIdx .. lastIdx] = newValues { ... }
The code between { and } is the code listed above to compute ANGLE_VALUES and START_VALUES
Secondly, I want my ARC array to be changed each time new values are provided. This is where the bind keyword is used, just replace the ARC definition listed above with
def ARCS : Arc[] = bind for (angle in ANGLE_VALUES ) { ... }
Using the component
In your Main class, use the code below to actually create and display a PieChart
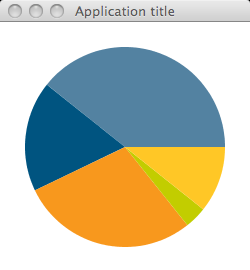
Stage {
title:  "Application title"
width: 250
height: 270
scene: Scene {
content: PieChartFX {
values: [ 110, 50, 80, 10, 30]
}
}
}
The end result is displayed below.

My next blog entry will improve this component : we will add some 3D look and we will add code to slightly move a piece out of the PieChart when the mouse is over it. Full source code will be provided.
Stay Tuned !